
Blog
Why seakeeping hydrodynamics are limited in extreme conditions

Lava crickets run toward volcanoes. This is a bit surprising because our natural inclination is to run away from heat and danger of hot magma flow. But this is part of the Lava Cricket survival strategy. Their preferred niche is the barren, heated wastes near active flows. It seems they thrive in this special niche because no predators are lurking around to threaten them. That’s quite a niche!
Yet because of the active lava flows, there aren’t plants around either. In fact, they leave the area once plants start to colonize. This raises an important question: what do they eat to stay alive? It turns out there’s enough for them scattered in the air: they eat windblown nutrients, like plants and sea foam. It’s not much, but it’s enough for them to thrive.
It’s a strategy that works for them by relying on extreme conditions. But extreme conditions aren’t something that works for everyone. Quite the opposite, we often want as much warning as possible to avoid what could be a dangerous situation. In the world of ship motion prediction, we want to get a picture of what happens at sea in a range of conditions – from flat calm to the worst case scenario. And in these worst case extreme conditions, our analysis tools might start to break down, and uncertainty is lurking around, threatening to attack the validity of your results. Yet seakeeping tools have been used for decades, helping the design process thrive. So what does extreme conditions really mean in the context of seakeeping analysis, and when do we expect this to be a problem? In this article, we’re going to expand on what extreme conditions mean for traditional seakeeping analysis tools and when to gauge whether they might affect the quality of results.
In the context of ship motion prediction, extreme conditions usually mean there are large changes to the wetted hull area of the vessel
You might naturally envision a ship crashing through waves in a heavy storm, and this indeed would be a good example of extreme conditions. However, the changes in wetted hull area depend on both the severity of the waves and the nature of the floating system. The largest crude carriers or container ships, hundreds of meters long, don’t experience storm waves the same way a smaller vessel like a yacht or patrol boat might. Yet severe sea states aren’t the only way you could get extreme conditions, either, which brings us to the nature of the vessel.
Extreme conditions can happen during resonance in specific conditions
The mildest sea state conditions can sometimes line up with one of the ship’s natural periods in heave, pitch, or roll. In that case, you don’t need much in terms of wave heights to really start triggering resonance and large motions, which in turn means significant changes in wetted hull area. Parametric roll is a form of resonance that can be surprisingly common. However, usually there is at least some control available to avoid this situation. Changing the vessel’s heading or speed can help prevent a problematic resonance condition. This means ship motion prediction in extreme sea states tends to be a focus in ship motion prediction. So what does the link to changing wetted hull area really mean as a limiting factor for ship motion prediction tools?
It’s common for seakeeping tools to assume small changes to wetted hull area
The reason for this is that the hydrodynamic loads, like wave excitation and wave radiation forces, are normalized around a particular wetted hull area. This assumption unlocks powerful frequency domain seakeeping analysis processes that can evaluate ship motion in a wide range of sea state conditions with relatively little computational effort. But how specifically is the wetted hull area used in formulating the forces acting on the hull?
Ultimately, seakeeping analysis methods must resolve the net forces acting on the ship
This includes resolving the wave excitation, radiation, and other hydrodynamic forces acting on the hull. But the net forces are the end goal. To resolve the forces, you need to use an intermediary step in calculating the pressure field over the hull. And to calculate the pressure field, you need to solve the ocean wave interaction with the specific shape of the hull. Once the wave interaction calculation is completed, the summation of the pressure field over the hull resolves the net forces from effects like wave excitation, wave radiation, and hydrostatics. What makes this summation of pressure simpler is by assuming there is a relatively constant wetted hull area. This simplifies the integration of the pressure field to resolve the various net forces acting on the system. But what does this specifically look like, and what are the implications?
Let’s look at an example
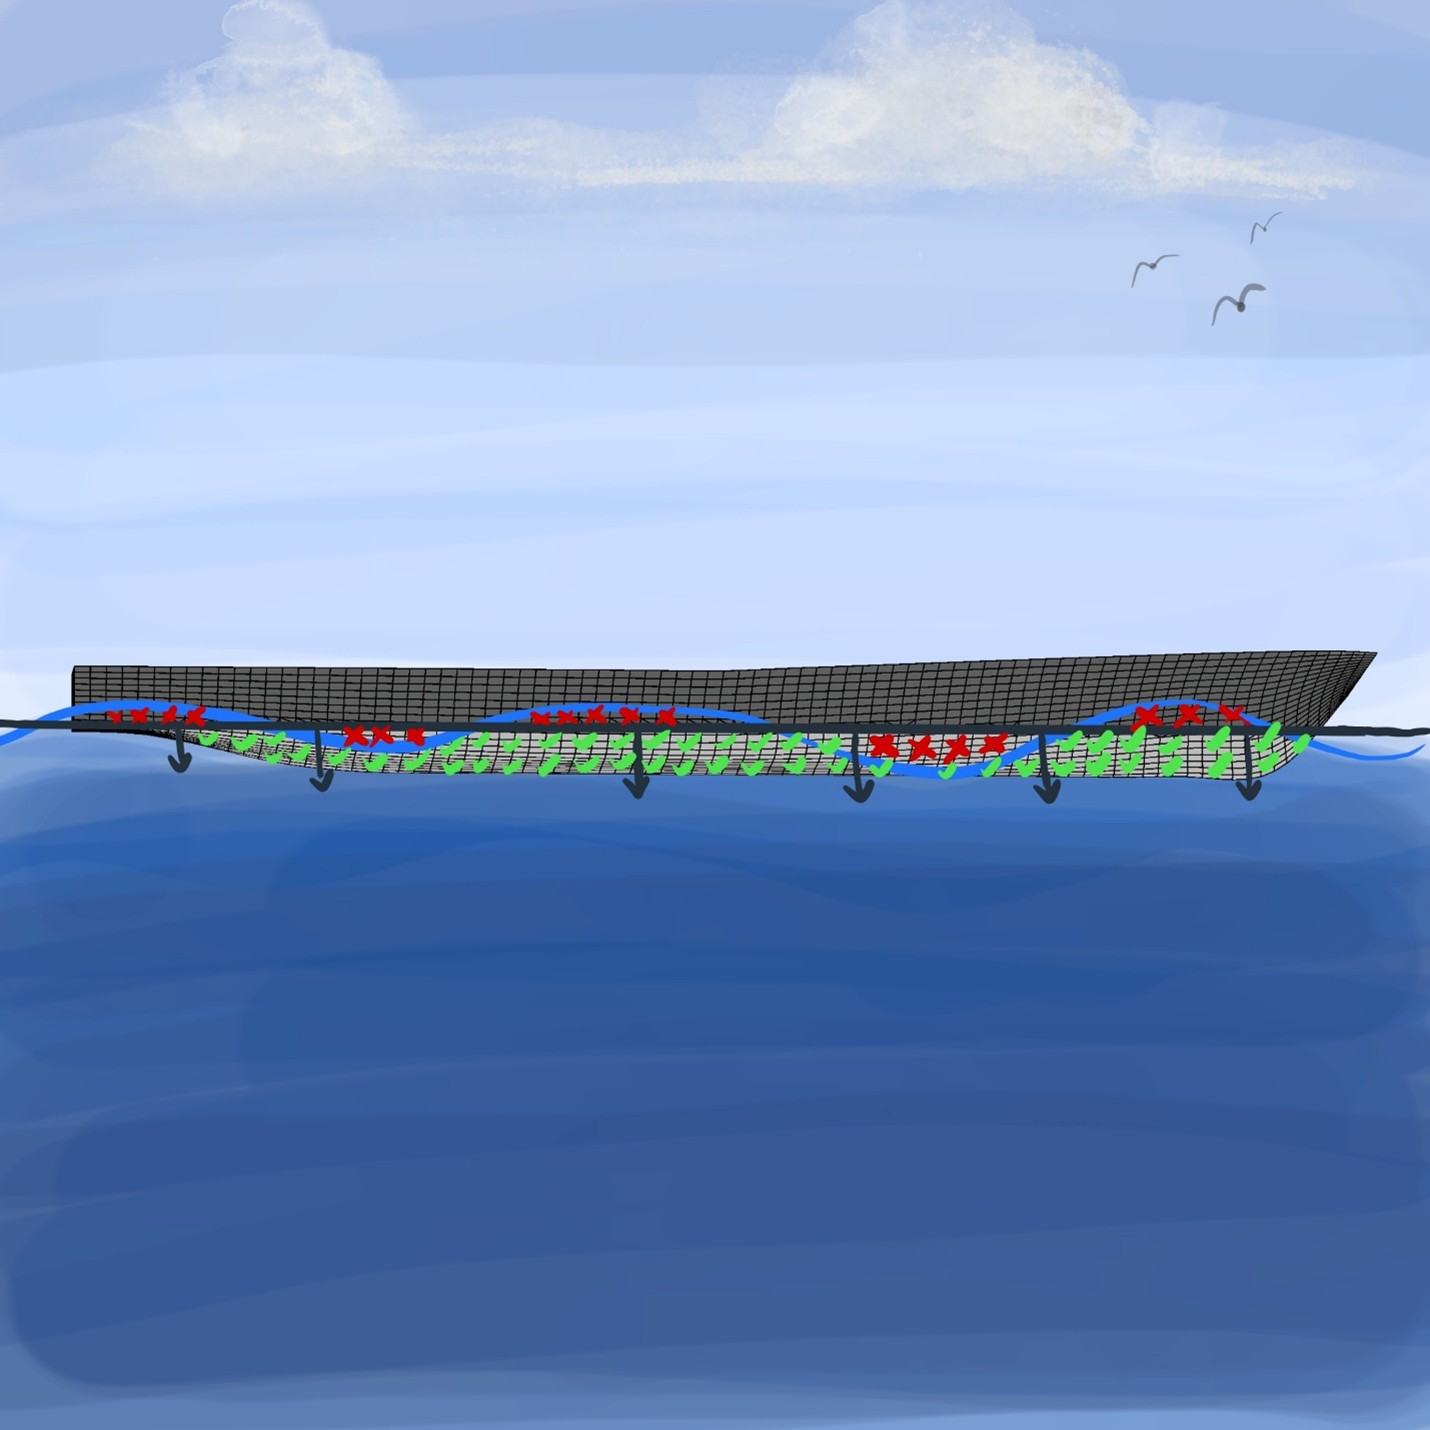
This is a representative visual of the incident pressure field acting on the Generic Frigate under a sinusoidal wave train. We’re going to only look at the undisturbed pressure field for now, but a similar approach is used to resolve the forces from the disturbed wave surface that produces the diffraction, or scattering load, as well as the wave radiation loads acting on the hull. This gives you a visual indicator of one factor of how wetted hull area can change when there are huge wave crests and troughs, like you might expect for a vessel in extreme conditions.
A typical seakeeping analysis tool introduces the nominal wetted hull area and then integrates the pressure field over this region. Note how the assumption of a nominal wetted area results in cutting off the pressure contribution of wave crests along the water surface. Yet at the same time wave troughs have no pressure contribution, either, on the wetted hull area. For large vessels like the Generic Frigate, the error from truncating moderate waves doesn’t have as much of an impact because of the averaging out of forces across such a large expanse of hull area. Yet at the same time, the uncertainty and error can grow as the wave height increases.
What about the effects of severe ship motion in waves?
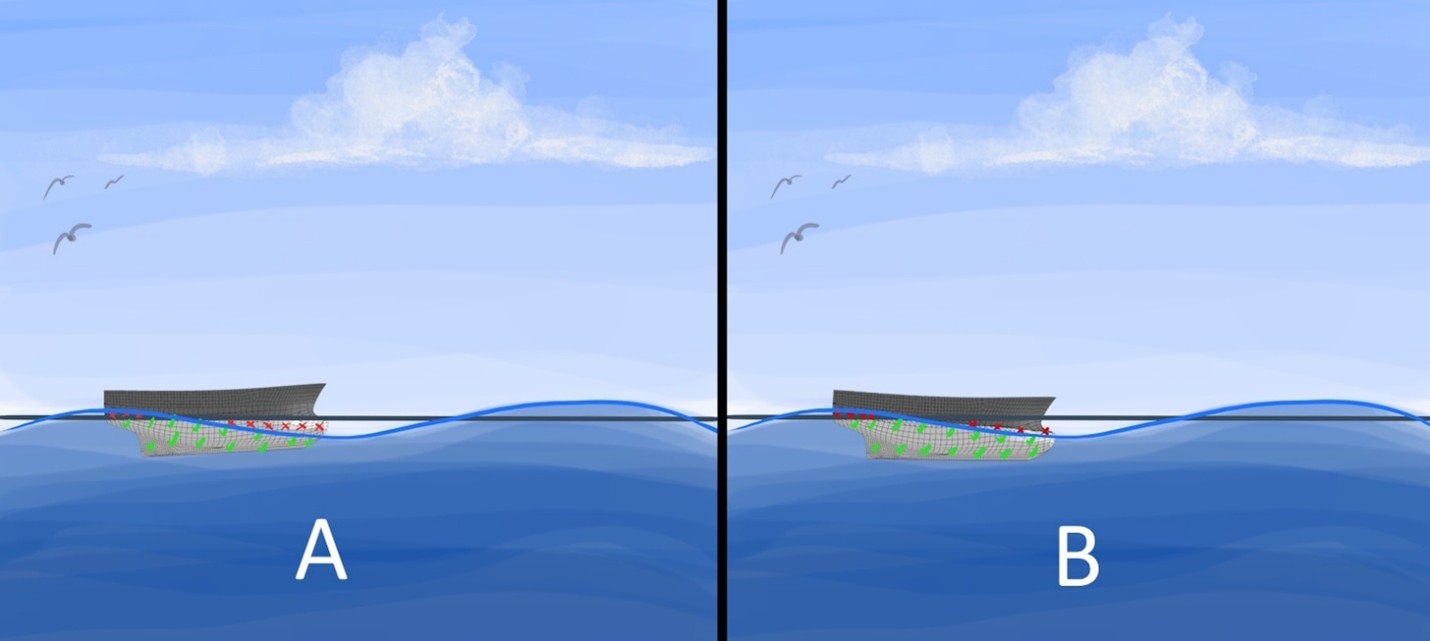
The example shows a static ship hull in water. In reality, of course, the ship is moving through waves, and the coupled motion of the hull in waves can create substantial changes in wetted hull area. Yet often in extreme conditions, the ships tend to follow the water surface, which reduces the changes in wetted hull area. Here’s another example of the Generic Fishing Vessel in extreme conditions. The vessel is 25m long, with a 3m draft. The wave shown is representative of a 3m high, 7s wave with a wavelength of ~75m. Showing the static vessel position shows quite a bit of error in wetted hull area as the bow is quite exposed at that phase of the wave. But this first picture shows the fishing vessel at the static calm waterline position. In reality, in a condition like this, the ship would be following the water surface more closely. Incorporating ship motion would show something more like this, where the hull pitches as it follows the wave surface, and the error from the change in wetted hull surface is not as significant.
But what about a condition when the ship doesn’t have time to respond to a steep wave and follow the water surface?
In certain extreme situations, a steep wave could approach the bow, and the wetted hull area could dramatically shift.
In some cases, the changes in wetted hull area can be addressed using a different approach. In a time domain seakeeping analysis, it’s possible to use the instantaneous wetted hull area to calculate incident wave and hydrostatic loads on the hull. While this technique is commonly used, it still leaves the wave radiation and diffraction loads approximated around a nominal wetted area. It provides a potentially improved, if not perfect, picture of how the seakeeping effects might change. The other challenge is that time domain seakeeping analysis is much more computationally time consuming – though still far less demanding than more detailed CFD methods. Nevertheless, what does this mean in terms of uncertainty around ship motion prediction values?
There aren’t hard limits to the changes in wetted hull area
The ship motion prediction values will not necessarily change dramatically as the error in wetted hull area increases. What it will do is increase the uncertainty in the results. Yet it’s challenging to sense how much uncertainty there may be because of the way the net forces tend to balance out, and how the ship may follow the water surface in more extreme conditions. However, you can get a sense of whether the wave conditions – both total wave height, and also steepness – is severe for the type of ship you are looking at. Other ways to gauge this are to assess visually what the variation in wetted look like through a visualization or from a time domain analysis.
It’s summary time
We covered a few facets on the limitations of seakeeping analysis in extreme conditions, and it’s time to summarize. Many seakeeping analysis tools provide a quick way to get thorough insight into ship motion performance at sea. But to do this, there’s an underlying assumption that the wetted area of the hull is relatively constant. It’s this assumption that allows for simplifications in how the hydrodynamic forces are resolved that form part of the ship motion prediction process. This is then one of the primary sources of limitation in the use of these tools – when the wetted hull area undergoes significant changes, which is most often in extreme conditions. While extreme conditions could mean a resonant condition in a mild sea state, usually what’s of interest to design is exploring motion in extreme wave and steep wave conditions. It’s in these conditions there’s a risk of large changes to wetted hull area, and then the results will naturally have more uncertainty. In this case, you will need special care to be watchful around these extreme conditions – perhaps similar to the lava cricket that thrives near molten magma flows, but obviously doesn’t get too close either.
Next step
In this article, we mentioned both frequency domain and time domain seakeeping analysis. Read up on these fundamentally different approaches to seakeeping analysis in these previous articles here and here.